Atlas by Nomic: Visualize embeddings from MongoDB and sanity-check your dataset
If you're new to embeddings, here's the 20-second version.
An embedding is just a vector (a list of numbers) that represents some piece of content (a sentence, a chunk, a product description, a song, whatever) in a way that captures meaning. Similar things end up close together in that vector space. Different things end up far apart.
That's why embeddings power things like:
- Semantic search ("find stuff like this")
- RAG (retrieve relevant context before prompting)
- Recommendations ("people who liked X also like Y")
- Clustering ("what themes exist in my dataset?")
But here's the catch: you can generate embeddings all day and still be wrong. Bad preprocessing, mixed models, biased sampling, noisy metadata… and suddenly your vectors are technically valid but practically useless.
If you want a good mental model of embeddings and vector spaces, two references I keep recommending are:
- Jay Alammar's blog post: The Illustrated Word2vec (jalammar.github.io)
- The classic paper behind word2vec: Mikolov et al., Distributed Representations of Words and Phrases and their Compositionality (proceedings.neurips.cc)
At some point, if you're doing embeddings (RAG, semantic search, recommendations, clustering…), you hit this moment:
"Ok… I'm generating vectors. But do they make any sense?"
Vector search can return results, sure. But a visual map gives you something else: intuition.
- Are my genres actually clustering together?
- Do I have duplicates or weird outliers?
- Is my metadata noisy?
- Did I accidentally mix embeddings from different models?
This post is about building that intuition fast.
I'll show how to export embeddings stored in MongoDB and upload them into Nomic Atlas (Nomic's Atlas, not MongoDB Atlas) so you can explore them visually.
This isn't a replacement for evaluation metrics or offline experiments. It's a sanity check + debugging tool. The "why is this cluster weird?" kind of tool.
Quick note: Atlas vs Atlas (yeah…)
- MongoDB Atlas = MongoDB's DBaaS
- Nomic Atlas = a tool to map/visualize embeddings
Confusing name, but honestly: useful.
When I'd use this (and when I wouldn't)
Use it when…
- You want a quick "does this space look right?" check before investing more time.
- You're debugging embedding quality (bad chunks, wrong language, mixed sources).
- You want to explain the dataset to someone without showing them 20,000 JSON docs.
- You suspect your pipeline is drifting (new sources, new model, new preprocessing).
Don't use it when...
- Your dataset is sensitive and you're not 100% sure what you're uploading.
- You're treating this as "proof" that retrieval works.
- A map can tell you "this looks weird" or "this clusters nicely".
- It can't tell you "my top-k results are correct for real user queries".
- Use the map to debug. Use evaluation to decide if it's good enough to ship.
- You're trying to upload everything from a huge dataset from your laptop (sample first).
My rule: if I wouldn't paste that data in Slack, I don't upload it.
What we're going to upload
From MongoDB we'll extract:
id(string)lyrics_embeddings_en(vector)artistgenre- one tag (first tag only, just to keep it simple)
Then:
- embeddings go into a NumPy array
- metadata into a DataFrame
- upload using
atlas.map_data(...)
That's it.
The important part is: do it in a way that doesn't lie to you.
The "don't lie to yourself" checklist
Before we even touch code:
-
Sampling matters
- "first 20k docs" is not a sample, it's an accident.
- If you can: use
$sample, or build cohorts (by time window, by source, by language).
-
One dataset = one model + one version
- Mixing models makes the map look like noise.
- Even if the dimensions match, the space can shift.
-
Metadata is not decoration
- The whole point is to filter and explain clusters.
- If you don't have good labels (genre/tag), you'll stare at dots.
-
Treat this as an artifact
- Nomic Atlas isn't your source of truth.
- Version datasets (
v1,v2) instead of overwriting.
Install and login
Get a token here: https://atlas.nomic.ai/cli-login
pip install nomic pymongo pandas numpy
nomic login <TOKEN>
Script
A few things I recommend:
- Use env vars for credentials / config.
- Validate embedding dimensions.
- Keep metadata small and useful (IDs + categories beat dumping full text).
import os
from pymongo import MongoClient
from nomic import atlas
from pandas import DataFrame
import numpy as np

MONGODB_URI = os.environ.get("MONGODB_URI")
DB_NAME = "streamingvectors"
COLL_NAME = "lyrics"

LIMIT = int(os.environ.get("LIMIT", "20000"))
DATASET_ID = os.environ.get("NOMIC_DATASET_ID", "lyrics_dataset")

# Optional: random sampling (recommended)
USE_SAMPLE = os.environ.get("USE_SAMPLE", "false").lower() == "true"
SAMPLE_SIZE = int(os.environ.get("SAMPLE_SIZE", str(LIMIT)))


def main():
    if not MONGODB_URI:
        raise ValueError("Missing MONGODB_URI env var")

    client = MongoClient(MONGODB_URI)

    pipeline = [
        {"$match": {"lyrics_embeddings_en": {"$exists": True}}},
        {"$addFields": {"id": {"$toString": "$_id"}}},
        {
            "$project": {
                "_id": 0,
                "id": 1,
                "lyrics_embeddings_en": 1,
                "artist": 1,
                "genre": 1,
                "tags": {"$first": "$tags"},
            }
        },
    ]

    if USE_SAMPLE:
        pipeline.append({"$sample": {"size": SAMPLE_SIZE}})
    else:
        pipeline.append({"$limit": LIMIT})

    docs = list(client[DB_NAME][COLL_NAME].aggregate(pipeline, allowDiskUse=True))
    if not docs:
        raise ValueError("No documents found with lyrics_embeddings_en")

    embeddings = [d["lyrics_embeddings_en"] for d in docs]
    dims = {len(e) for e in embeddings}
    if len(dims) != 1:
        raise ValueError(f"Inconsistent embedding dimensions found: {dims}")

    embeddings_np = np.array(embeddings, dtype=np.float32)

    df = DataFrame(
        [
            {
                "id": d["id"],
                "artist": str(d.get("artist", "")),
                "genre": str(d.get("genre", "")),
                "tag": str(d.get("tags", "")),
            }
            for d in docs
        ]
    )

    print(f"Uploading {len(df)} rows to Nomic Atlas dataset: {DATASET_ID}")
    print(f"Embedding dims: {list(dims)[0]}")

    atlas.map_data(
        data=df,
        embeddings=embeddings_np,
        id_field="id",
        identifier=DATASET_ID,
    )

    print("Done. Open Nomic Atlas and explore the map.")


if __name__ == "__main__":
    main()
Run it
export MONGODB_URI="mongodb+srv://..."
export LIMIT=20000
export NOMIC_DATASET_ID="lyrics_dataset"

# optional, recommended
export USE_SAMPLE=true
export SAMPLE_SIZE=20000

python3 upload_nomic.py
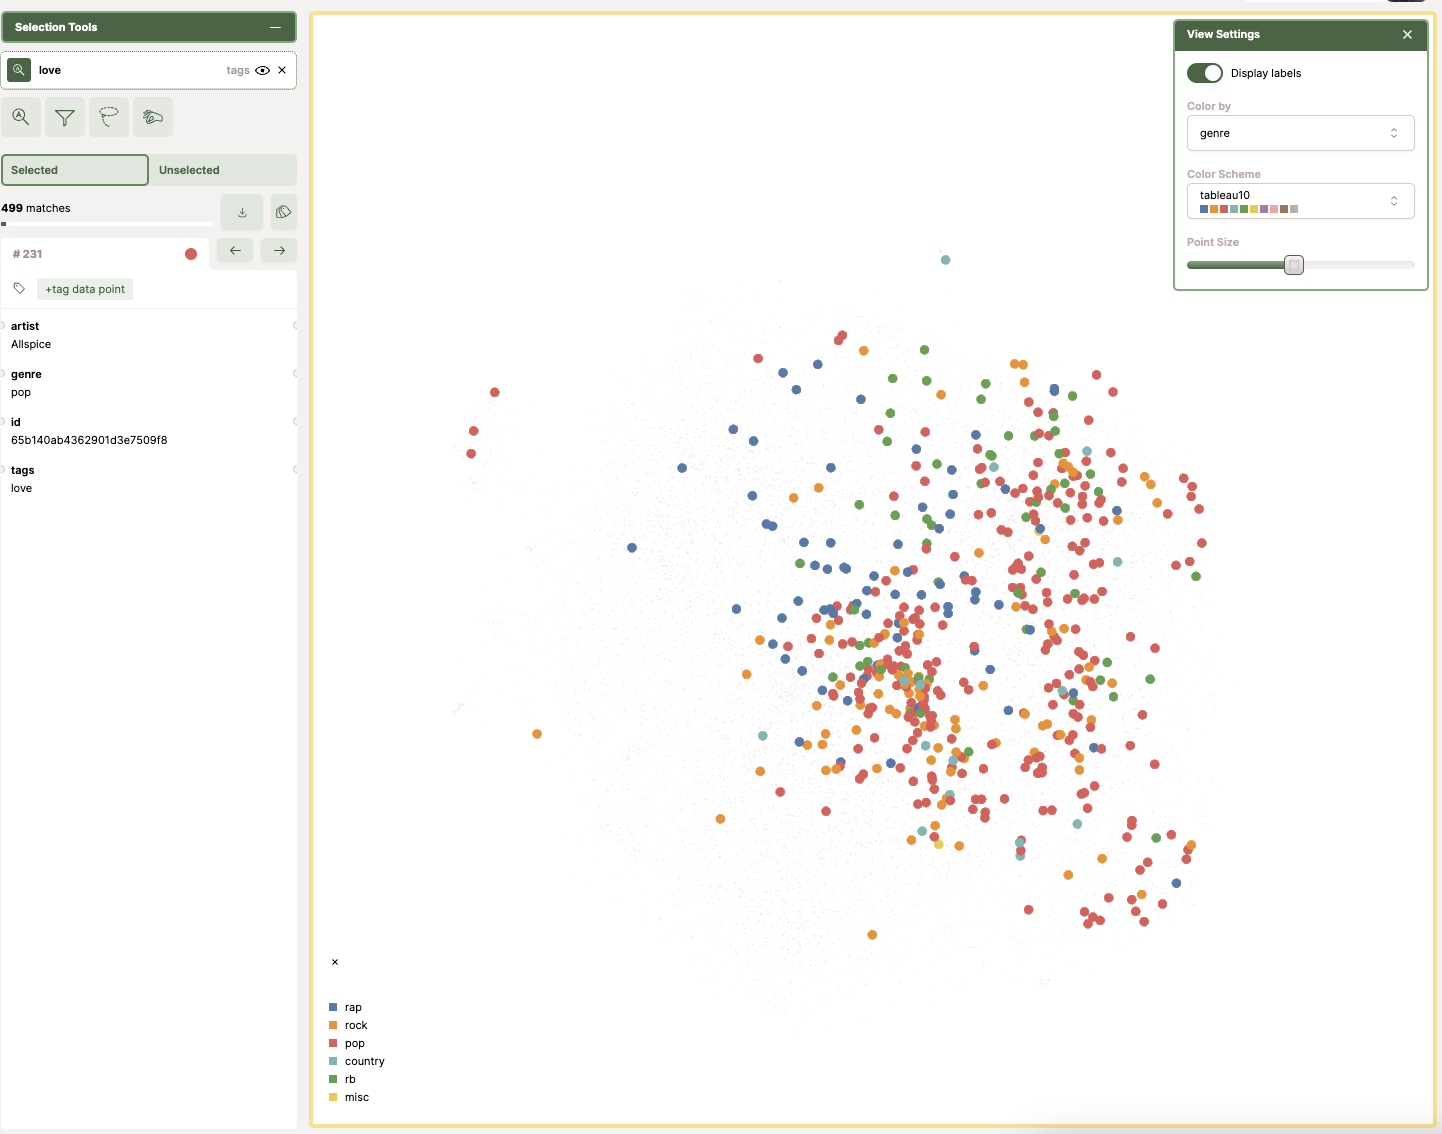
How to explore the map (what I did with the "love" tag)
Once you have executed the script, it will:
- read the lyrics in English
- grab the first tag from the
tagsarray (I'm keeping it simple here) - extract the embeddings (
lyrics_embeddings_en) - load everything into a DataFrame
- upload it to Nomic Atlas
Then you can explore the dataset and filter by terms.
In my case, I filtered by the tag "love". In the map, each dot represents a song and the color represents its genre. When I applied the filter, most of the highlighted dots were pop.
This is the kind of thing I like about a map: you don't need a full dashboard to get a first insight. You can spot patterns quickly, and then decide what you want to measure properly next.
If you want to replicate the same flow:
-
Filter by genre
- If genres don't cluster at all, your embeddings might still be fine, but your labels might not be good.
-
Search for a term or tag that should be "localized"
- Example: "love" will usually light up a region.
-
Pick a weird cluster
- Open 10 points. Ask: what do they share?
- This is where you find preprocessing bugs (wrong language, empty text, boilerplate).
-
Look for outliers
- Outliers are either junk data or interesting edge cases.
What breaks in real life
1) Sampling bias
If you upload "first N docs", you often get:
- one time range
- one data source
- one ingestion shard
…and you convince yourself the whole dataset looks like that.
2) Model drift
Even if you keep the same dimension, switching from model A to model B will shift the space.
If you do that, create a new dataset.
3) Metadata quality is everything
If your tags/genres are inconsistent, the map can still be correct — you just won't be able to interpret it.
Sometimes the fix isn't "better embeddings". It's "stop using messy labels".
4) Privacy / compliance
I'll repeat it because people forget: don't upload stuff you can't justify.
What I'd do next
If you want to take this from "cool visualization" to "useful engineering tool":
- Add a small evaluation loop (precision@k on a labeled subset). If you want a solid reference for the basics of ranked retrieval evaluation, the Stanford IR book chapter is great: https://nlp.stanford.edu/IR-book/html/htmledition/evaluation-of-ranked-retrieval-results-1.html.
- Run the Nomic upload from a CI job (versioned datasets).
- Keep a lightweight "embedding health" dashboard: dimension, null rate, model version, source distribution.
Related links
Embeddings / vector space intuition
- The Illustrated Word2vec (Jay Alammar): https://jalammar.github.io/illustrated-word2vec/
- Mikolov et al. (word2vec paper): https://proceedings.neurips.cc/paper/5021-distributed-representations-of-words-and-phrases-and-their-compositionality.pdf
- Sentence-BERT (Reimers & Gurevych): https://arxiv.org/abs/1908.10084
Retrieval evaluation
- Stanford IR book - evaluation of ranked retrieval: https://nlp.stanford.edu/IR-book/html/htmledition/evaluation-of-ranked-retrieval-results-1.html
- Weaviate - retrieval evaluation metrics overview: https://weaviate.io/blog/retrieval-evaluation-metrics
- Evidently - Precision/Recall@k for ranking: https://www.evidentlyai.com/ranking-metrics/precision-recall-at-k
MongoDB / data extraction
- PyMongo + data analysis: https://www.mongodb.com/developer/languages/python/pymongoarrow-and-data-analysis/
Tooling
- Nomic Atlas CLI login: https://atlas.nomic.ai/cli-login