Did you know...
UK sewers carry dirty water from homes to sewage treatment plants, where it is cleaned and then sent back into rivers and streams. Sometimes, rain mixes with this dirty water, and when it rains a lot, the sewers might not be able to handle it all.
Storm overflows are like a safety net that stops sewers from flooding houses, gardens and streets. They help by sending some of the rainwater and dirty water into rivers and streams. Thames Water calls this mixture ‘storm discharge’. Even though it has some untreated sewage, storm discharge is mostly water, so it is diluted a lot.
The Environment Agency keeps an eye on storm overflows. Storm discharges are allowed under certain conditions, which are set by an Environment Agency permit. They should only be used when it is really needed. Thames Water does not turn them on by hand; they work automatically when the water level gets too high.
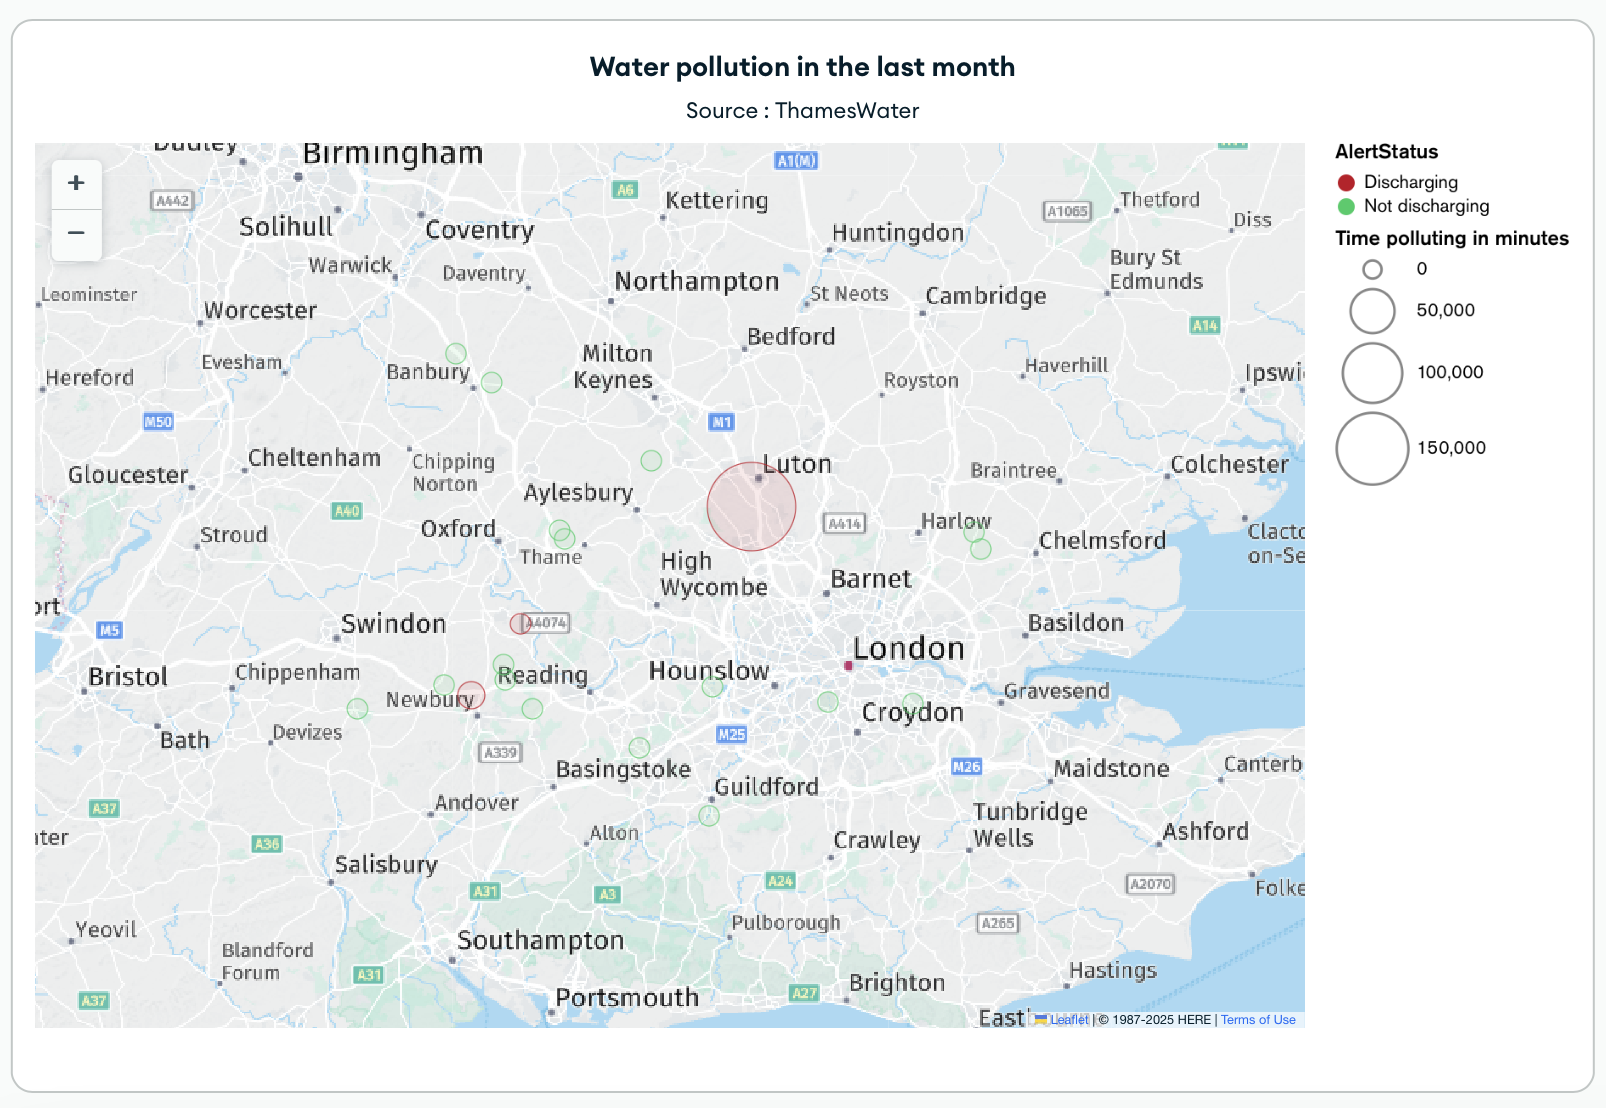
This is an interactive dashboard that shows the discharge activity at permitted locations by Thames Water.
If you want to see the more updated version of the dashboard click on this link. The passcode to access the dashboard is m8TUHZh92p%L
Why I did it?
It’s always struck me as quite amazing that we can just turn on a tap and get fresh, clean water. It really sinks in when you travel outside Europe and are told not to drink tap water—it makes you wonder how something so essential and vital as water isn’t a guaranteed basic service everywhere. It really gets you thinking, doesn’t it? Where does our water actually come from? Why do we sometimes have shortages or, on the other hand, have too much? How is it stored and spread out in our communities?
I have always been interested in understanding how this works.
Some history...
If you look into Europe’s past, the Roman Empire is known for creating amazing water systems using aqueducts and other related structures. These systems, which included pipes, fountains and public wells, were super important for bringing water to cities and homes.
What’s really interesting is how advanced Roman engineering was for their time. Their aqueducts, which often went for miles across valleys and mountains, were built so carefully that water could flow smoothly just by gravity. That’s already pretty impressive, but even more so is how these systems helped shape the water infrastructure we have today. The Romans didn’t just focus on getting people around—they also figured out how to store water, like in cisterns and reservoirs, and even included public health features like baths and latrines, which really emphasised hygiene in cities long before it was common.
But, the Roman water system wasn’t perfect. When they were distributing water in cities, they often used lead pipes, called fistulae. Back then, lead was valued for being strong and easy to shape. Now, we know that lead exposure can be really harmful to health. While some historians think that mineral buildup inside the pipes might have kept lead from getting into the water, others think that long-term exposure, especially from other uses of lead like cooking and preserving wine, could have caused health problems for the Roman elite. It’s a good reminder that even the best ideas can have unexpected side effects.
How it works today?
Today, London’s water comes mainly from Thames Water, which gets about 70 per cent of its water from the River Thames and the rest from underground sources. After the water is taken out, it gets treated a lot to get rid of any nasty stuff before it’s pumped out to everyone. But, London’s old pipes are still having a tough time keeping up with all the new stuff—especially when it comes to wastewater. The city uses a combined sewer system, which means rainwater and sewage go through the same pipes. When it rains a lot, the system can’t handle it, and untreated sewage spills right into the Thames. To fix this, the city is building the Thames Tideway Tunnel, a huge underground sewer that catches and holds overflow water until it can be properly treated—it’s a big project that’s trying to protect both the river and people’s health.
On the other hand, Madrid has a much newer and separate water and wastewater system, run by Canal de Isabel II. The city’s drinking water mostly comes from reservoirs in the Sierra de Guadarrama mountains and is cleaned up in fancy purification plants before it’s sent out. Madrid’s sewer system is separate, so rainwater and wastewater usually go through different systems, which helps keep the water clean. Plus, the city has put a lot of money into recycling water and managing stormwater, which makes its system stronger against climate change and sudden downpours. Even though there are still some problems, Madrid’s system shows how careful and updated systems can help manage water in a big city in a sustainable way.
We can use Thames Water’s API to keep an eye on where sewage goes, how long it stays there and other important information all over the network.
How I did it?
Well, the first step is to create an account in Thames Water Open Data API website .
In particular we will use the Discharge To Environment (DTE) Data.
Discharge To Environment (DTE) Data
The DTE resource gives you data on how much water is flowing out of rivers at places that are allowed to do so, using something called event duration monitoring (EDM). You can find more about how our rivers are doing on our river health pages.
There are two ways to get to the DTE data.
We’re using endpoint 2, DTE - Current Status.
The DTE Current Status resource tells you about all the places where we are allowed to let water flow out, and it also shows you what’s happening with the water flow right now at each of them.
For instance, you could use this resource to see which sites are letting water out right now or have let water out in the last day and a half. It’s also used to fill in our storm discharge map.
If you have any questions about storm discharges or EDM, check out our frequently asked questions.
Source code
This is the source code used to gather the data from the API. After the data is retrieved, we use the library osgridref.js to convert coordinates received from the API in WGS84 format (World Geodetic System 1984 (WGS84) to latitude and longitude to be compatible with MongoDB.
After inserting the data, we run a MongoDB aggregation to process the data and then we create a MongoDB Atlas Chart to draw all the entries.
The code below is running in a function triggered in Atlas according to a cron expression. Once a day, we call the the discharge endpoint of the Thames Water OpenData API.
In order to call the endpoint we're using context.http.get which is a built-in client in App Services, an interface exposed to the context object.
import OsGridRef, { LatLon } from 'geodesy/osgridref.js';
exports = async function (arg) {


  // Find the name of the MongoDB service you want to use
  var serviceName = "mongodb-atlas";

  // Update these to reflect your db/collection
  var dbName = "ThamesWater";
  var collName = "thameswaterTemp";
  var collName2 = "ThamesWater";

  // Get a collection from the context
  var collection = context.services.get(serviceName).db(dbName).collection(collName);
  var collection2 = context.services.get(serviceName).db(dbName).collection(collName2);

  //Get the variables to call the API
  var client_id = context.values.get("thames_water_client_id");
  var client_secret = context.values.get("thames_water_client_secret_value");
  var url = "https://prod-tw-opendata-app.uk-e1.cloudhub.io/data/STE/v1/DischargeCurrentStatus";
  let headers = {
    "Content-Type": ["application/json"],
    "client_id": ['id1'],
    "client_secret": ['secret1']
  }
  let getArguments = {
    "url": url,
    "headers": headers
  };
  const response = await context.http.get(getArguments);
  let parsedResponse = JSON.parse(response.body.text());
  let result = parsedResponse.items;
  result.forEach(element => {
    let X = element.X;
    let Y = element.Y;
    let gridref = new OsGridRef(X, Y);
    let pWgs84 = gridref.toLatLon();
    let latitude = pWgs84.lat;
    let longitude = pWgs84.lon;
    let coordinatesObj = {
      "type": "Point",
      "coordinates": [longitude, latitude]
    }
    element.coordinates = coordinatesObj;

  });

  let aggregation = [
  {
    '$unset': [
      'X', 'Y'
    ]
  }, {
    '$set': {
      'MostRecentDischargeAlertStop': {
        '$ifNull': [
          '$MostRecentDischargeAlertStop', new Date()
        ]
      }
    }
  }, {
    '$set': {
      'StatusChange': {
        '$toDate': '$StatusChange'
      },
      'MostRecentDischargeAlertStart': {
        '$toDate': '$MostRecentDischargeAlertStart'
      },
      'MostRecentDischargeAlertStop': {
        '$toDate': '$MostRecentDischargeAlertStop'
      },
      'AlertPast48Hours': {
        '$toBool': '$AlertPast48Hours'
      }
    }
  }, {
    '$set': {
      'MinutesPolluting': {
        '$dateDiff': {
          'startDate': '$MostRecentDischargeAlertStart',
          'endDate': '$MostRecentDischargeAlertStop',
          'unit': 'minute'
        }
      }
    }
  }, {
    '$merge': 'ThamesWater'
  }
];

  var insertResult;
  var deleteResult;
  var aggregateResult;
  try {
    await collection2.deleteMany({});
    deleteResult = await collection.deleteMany({});
    insertResult = await collection.insertMany(result);
    aggregateResult = await collection.aggregate(aggregation).toArray();
    deleteResult = await collection.deleteMany({});


  } catch (err) {
    console.log("Error occurred while executing findOne:", err.message);

    return { error: err.message };
  }

  return { result: aggregateResult };
};
What this aggregation is doing is what you might ask... Well, it's very simple, it's just removing the X and Y fields that came from the Thames Water API (OsGridRef) as we just need the coordinates in latitude and longitude format to be used by MongoDB and Atlas Charts and then we're renaming some fields. Finally, we add the data from this temp collection to the final one called ThamesWater which is the one used by the Charts.